The 10 keys to the prosperity of U.S. cities now
10 April 2024
by Chris Fair, President & CEO, Resonance

16 June 2026
by Chris Fair, President & CEO, Resonance Consultancy
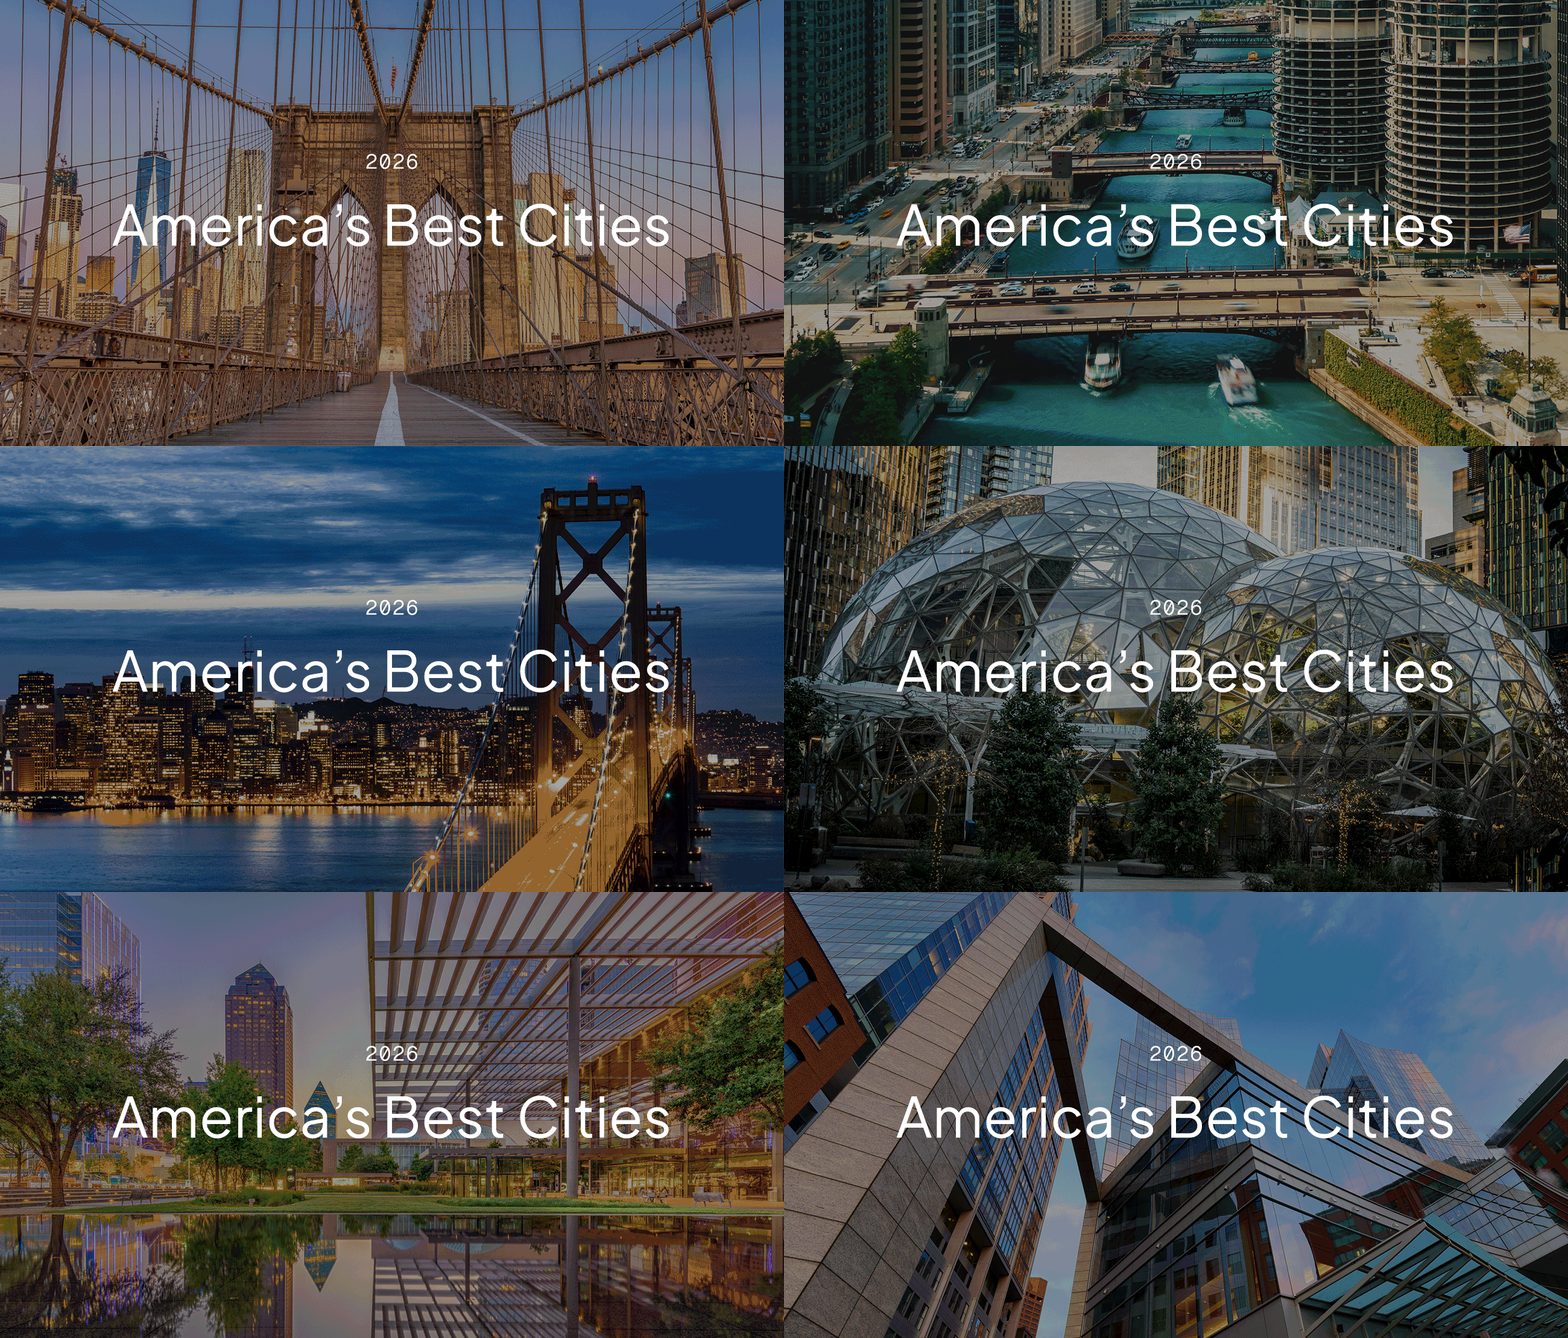
The top of the America’s Best Cities ranking hasn’t changed. New York, Los Angeles, and Chicago hold the first three positions again, and the Top 10 is populated by the metros you would expect – large, diversified, culturally dominant cities whose gravitational pull is difficult for any competitor to match.
The more revelatory story is happening further down the table. Across three years of national perception tracking conducted with Ipsos – surveying more than 2,000 U.S. households using open-ended, unprompted questions – only 11 cities improved their perception rankings across livability, lovability, and prosperity at the same time. They are New Orleans, Honolulu, Kansas City, Santa Fe, San Jose, Greenville, Richmond, Cleveland, Salem, Flagstaff, and Ann Arbor.
The list is deliberately eclectic. It includes a metro of 2 million (San Jose) and a metro of fewer than 145,000 (Flagstaff). A Silicon Valley powerhouse and an Oregon state capital best known for its proximity to wine country. A Gulf Coast cultural icon and a Rust Belt city most Americans still associate with decline. What makes the group meaningful is not what these places have in common on a map. It is what they have in common in the data – and what that data suggests about how perception actually moves.
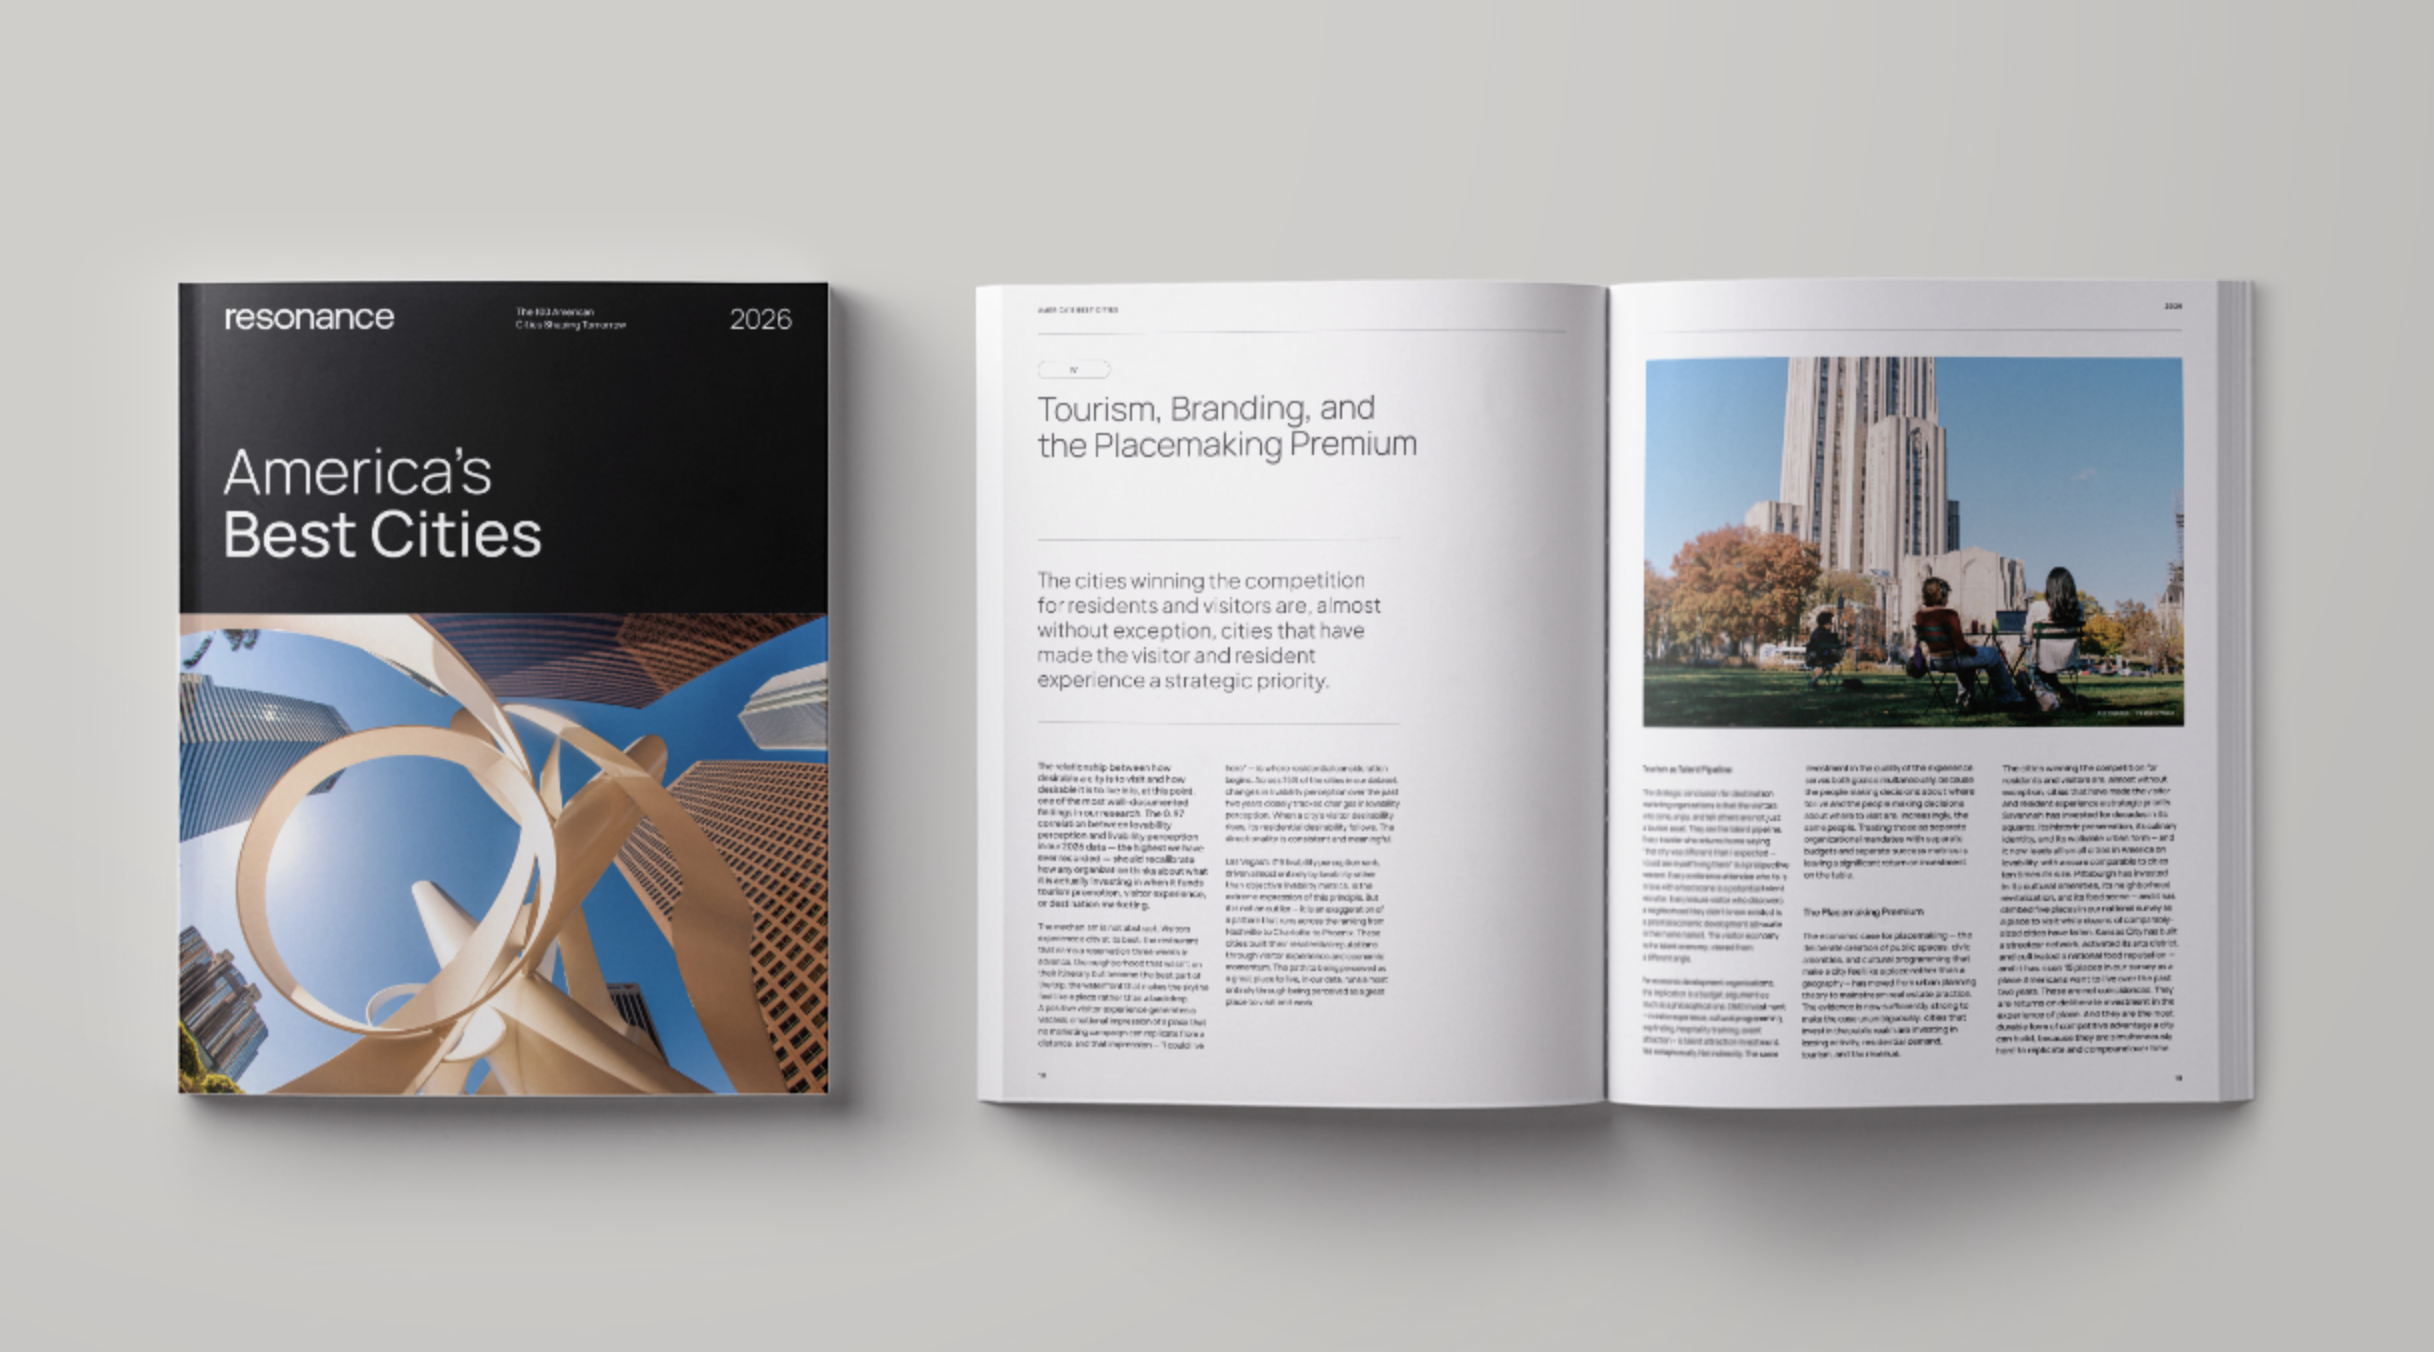
The 2026 America's Best Cities report. Download it for free.
Why These 11 Matter Right Now
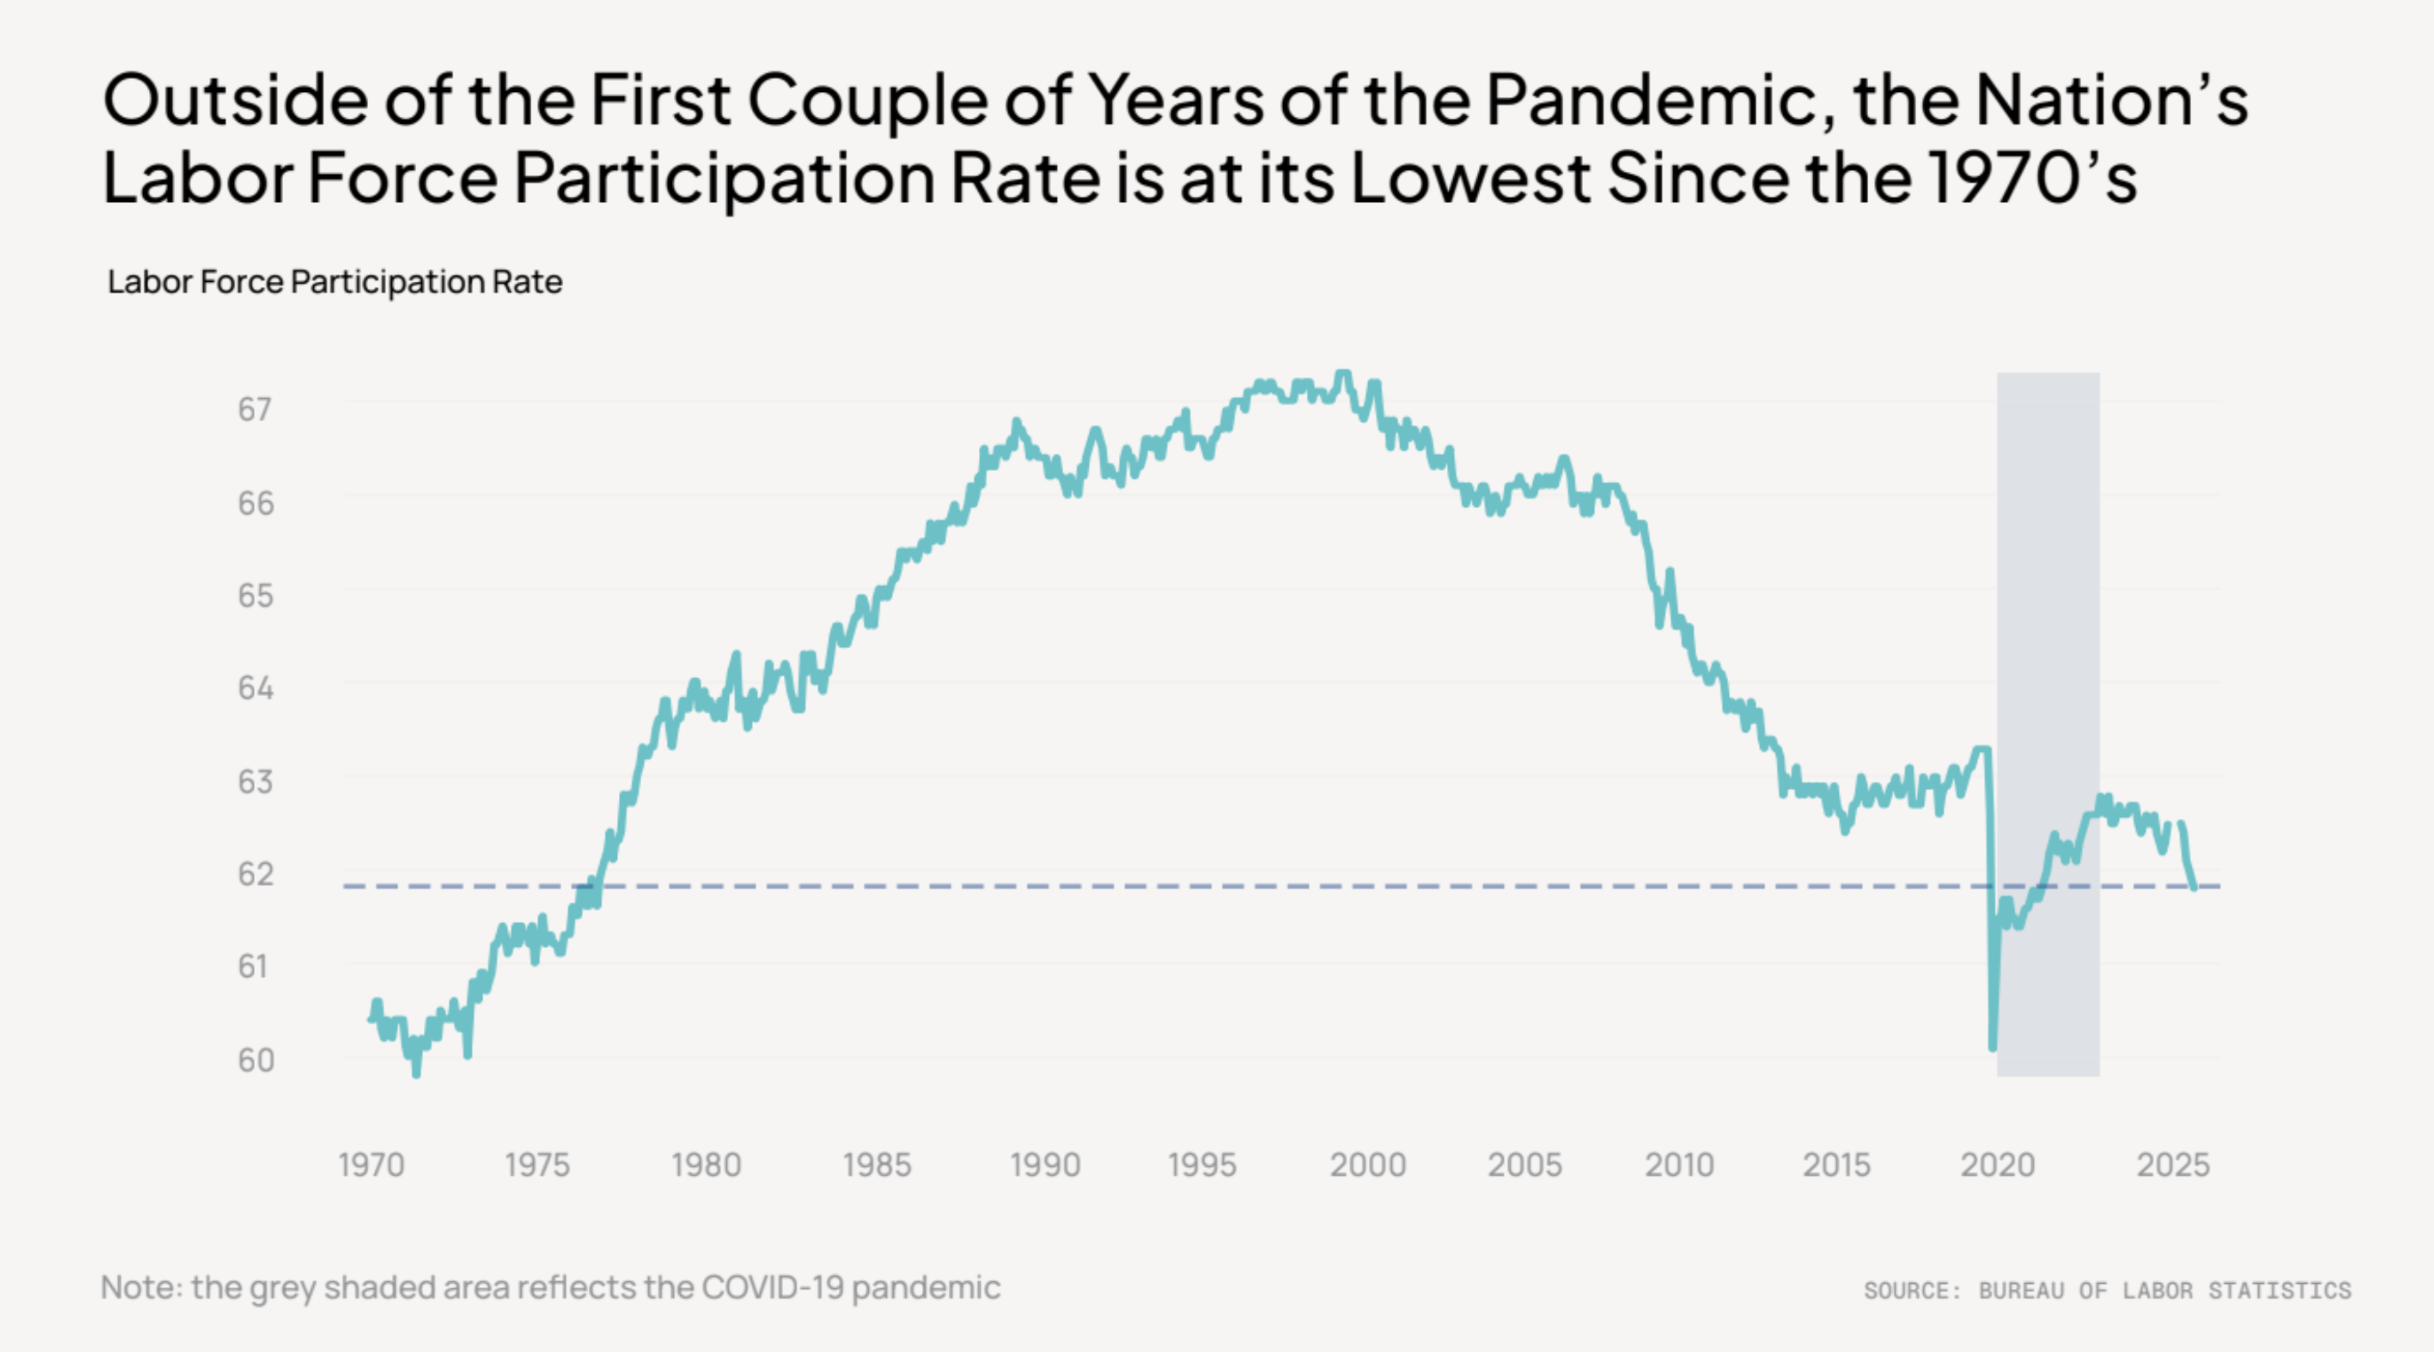
American cities are competing for a smaller pool of people than anyone recently assumed.
The nonpartisan Congressional Budget Office projects the U.S. population will grow from 350 million in 2025 to just 367 million by 2055 – the smallest growth projection the agency has ever published. By 2035, the population is expected to be 4.5 million fewer people than the CBO forecast as recently as January 2025.
The total fertility rate has fallen below 1.7, well beneath the 2.1 replacement level. Meanwhile, net international migration – the variable that historically offset domestic demographic slowdowns – dropped 54% in a single year, falling from roughly 2.7 million in 2023–24 to 1.3 million in 2024–25.
The working-age population, ages 25 to 54, will be meaningfully smaller than any prior projection assumed. That is the talent pool every city, region, and economic development organization is fighting for.
In a growing country, a city can afford to be passive about how it is perceived. In a country where the number of mobile, working-age people is contracting, perception becomes something closer to infrastructure – a structural asset that compounds or a structural liability that erodes. The 11 rising cities are places where perception is compounding.
The Competitive Field Is Wider Than It Has Ever Been
One number captures the shift. In 2024, 99 distinct U.S. cities appeared in survey respondents’ top-three selections for where they would most like to live, visit, or work. By 2025, that number reached 107. In 2026, it hit 115. Americans are paying attention to a wider set of cities than at any point in our research history – and that attention is real. It shows up in search trends, social media engagement, real estate inquiries, and migration patterns.
For cities that have been historically overlooked, this widening is a genuine opening. For cities that have relied on inherited reputation, it is an escalating challenge. More competitors mean more noise and a higher bar for distinction. The 11 rising cities are the ones that broke through on every dimension simultaneously, and the average perception improvement across the group was 0.24 percentage points across the three pillars – a modest-sounding figure that understates how difficult it is to move national perception in any direction when you are competing against 392 other metros for attention.
Five Distinct Models of Perception Growth
Within the 11, five cities pulled meaningfully ahead of the group average. Each one illustrates a different mechanism – and a different lesson.
Kansas City led the cohort at 0.43 percentage points of multi-pillar improvement, nearly double the group average. What makes Kansas City’s trajectory unusual is its balance. Most cities carry a pronounced pillar hierarchy – they are known primarily as a place to visit, or a place to work, or a place to live, with the other dimensions trailing behind. Kansas City’s perception across all three pillars is now among the most evenly distributed of any city in the ranking.
That breadth did not arrive through a single anchor event. It is the result of sustained, coordinated investment: a streetcar network that changed how people move through downtown, an arts district activation that changed how people experience it, a food reputation that has gone national, and a corporate base that continues to diversify. And, the Kansas City Chiefs winning multiple championships likely raised awareness and interest as well. Kansas City has risen 15 places in our survey as a place Americans want to live over the past two years. The lesson is patience and coordination across multiple fronts, not a single dramatic bet.
New Orleans (#23 overall) and Honolulu (#27) represent a different dynamic. Both cities generate visitor desire at extraordinary levels – their survey scores as places to visit run five to ten times higher than their scores as places to work. That kind of lovability dominance is not unusual. What is new in the 2026 data is that those lovability scores are beginning to lift livability and prosperity perception with them.
When people fall in love with a place as a destination, they start to imagine themselves living there – a pattern backed by the strongest statistical relationship in our entire dataset: a 0.97 correlation between lovability perception and livability perception, the highest we have ever recorded. For New Orleans and Honolulu, the visitor experience is doing double duty. It is a tourism asset and a residential recruitment signal operating through the same channel.
San Jose (#29) presents the mirror image. Prosperity perception runs eight times higher than lovability or livability – one of the most extreme pillar imbalances we have measured. San Jose is known nationally as a place to build a technology career. It is not yet known as a place to visit or a place to call home in a way that its economic fundamentals would justify. Its multi-pillar gains in 2026 are significant precisely because they signal a correction has begun. For any city whose national reputation is dominated by a single dimension – usually economic – San Jose is the leading indicator of what it looks like when that reputation starts to broaden.
Santa Fe (#60 overall, #6 among small cities) has the most internally coherent perception hierarchy in the group. Livability perception runs roughly twice its lovability score, which runs roughly twice its prosperity score – a clean reflection of what the city actually is. People want to live there above all, visit it secondarily, and think of it as a career destination last. The 2026 data suggests the audience for that specific positioning is expanding, not contracting. Santa Fe is proof that a clear, specific identity – even one that deliberately leaves certain dimensions in the background – can compound over time if it is authentic enough to sustain itself.
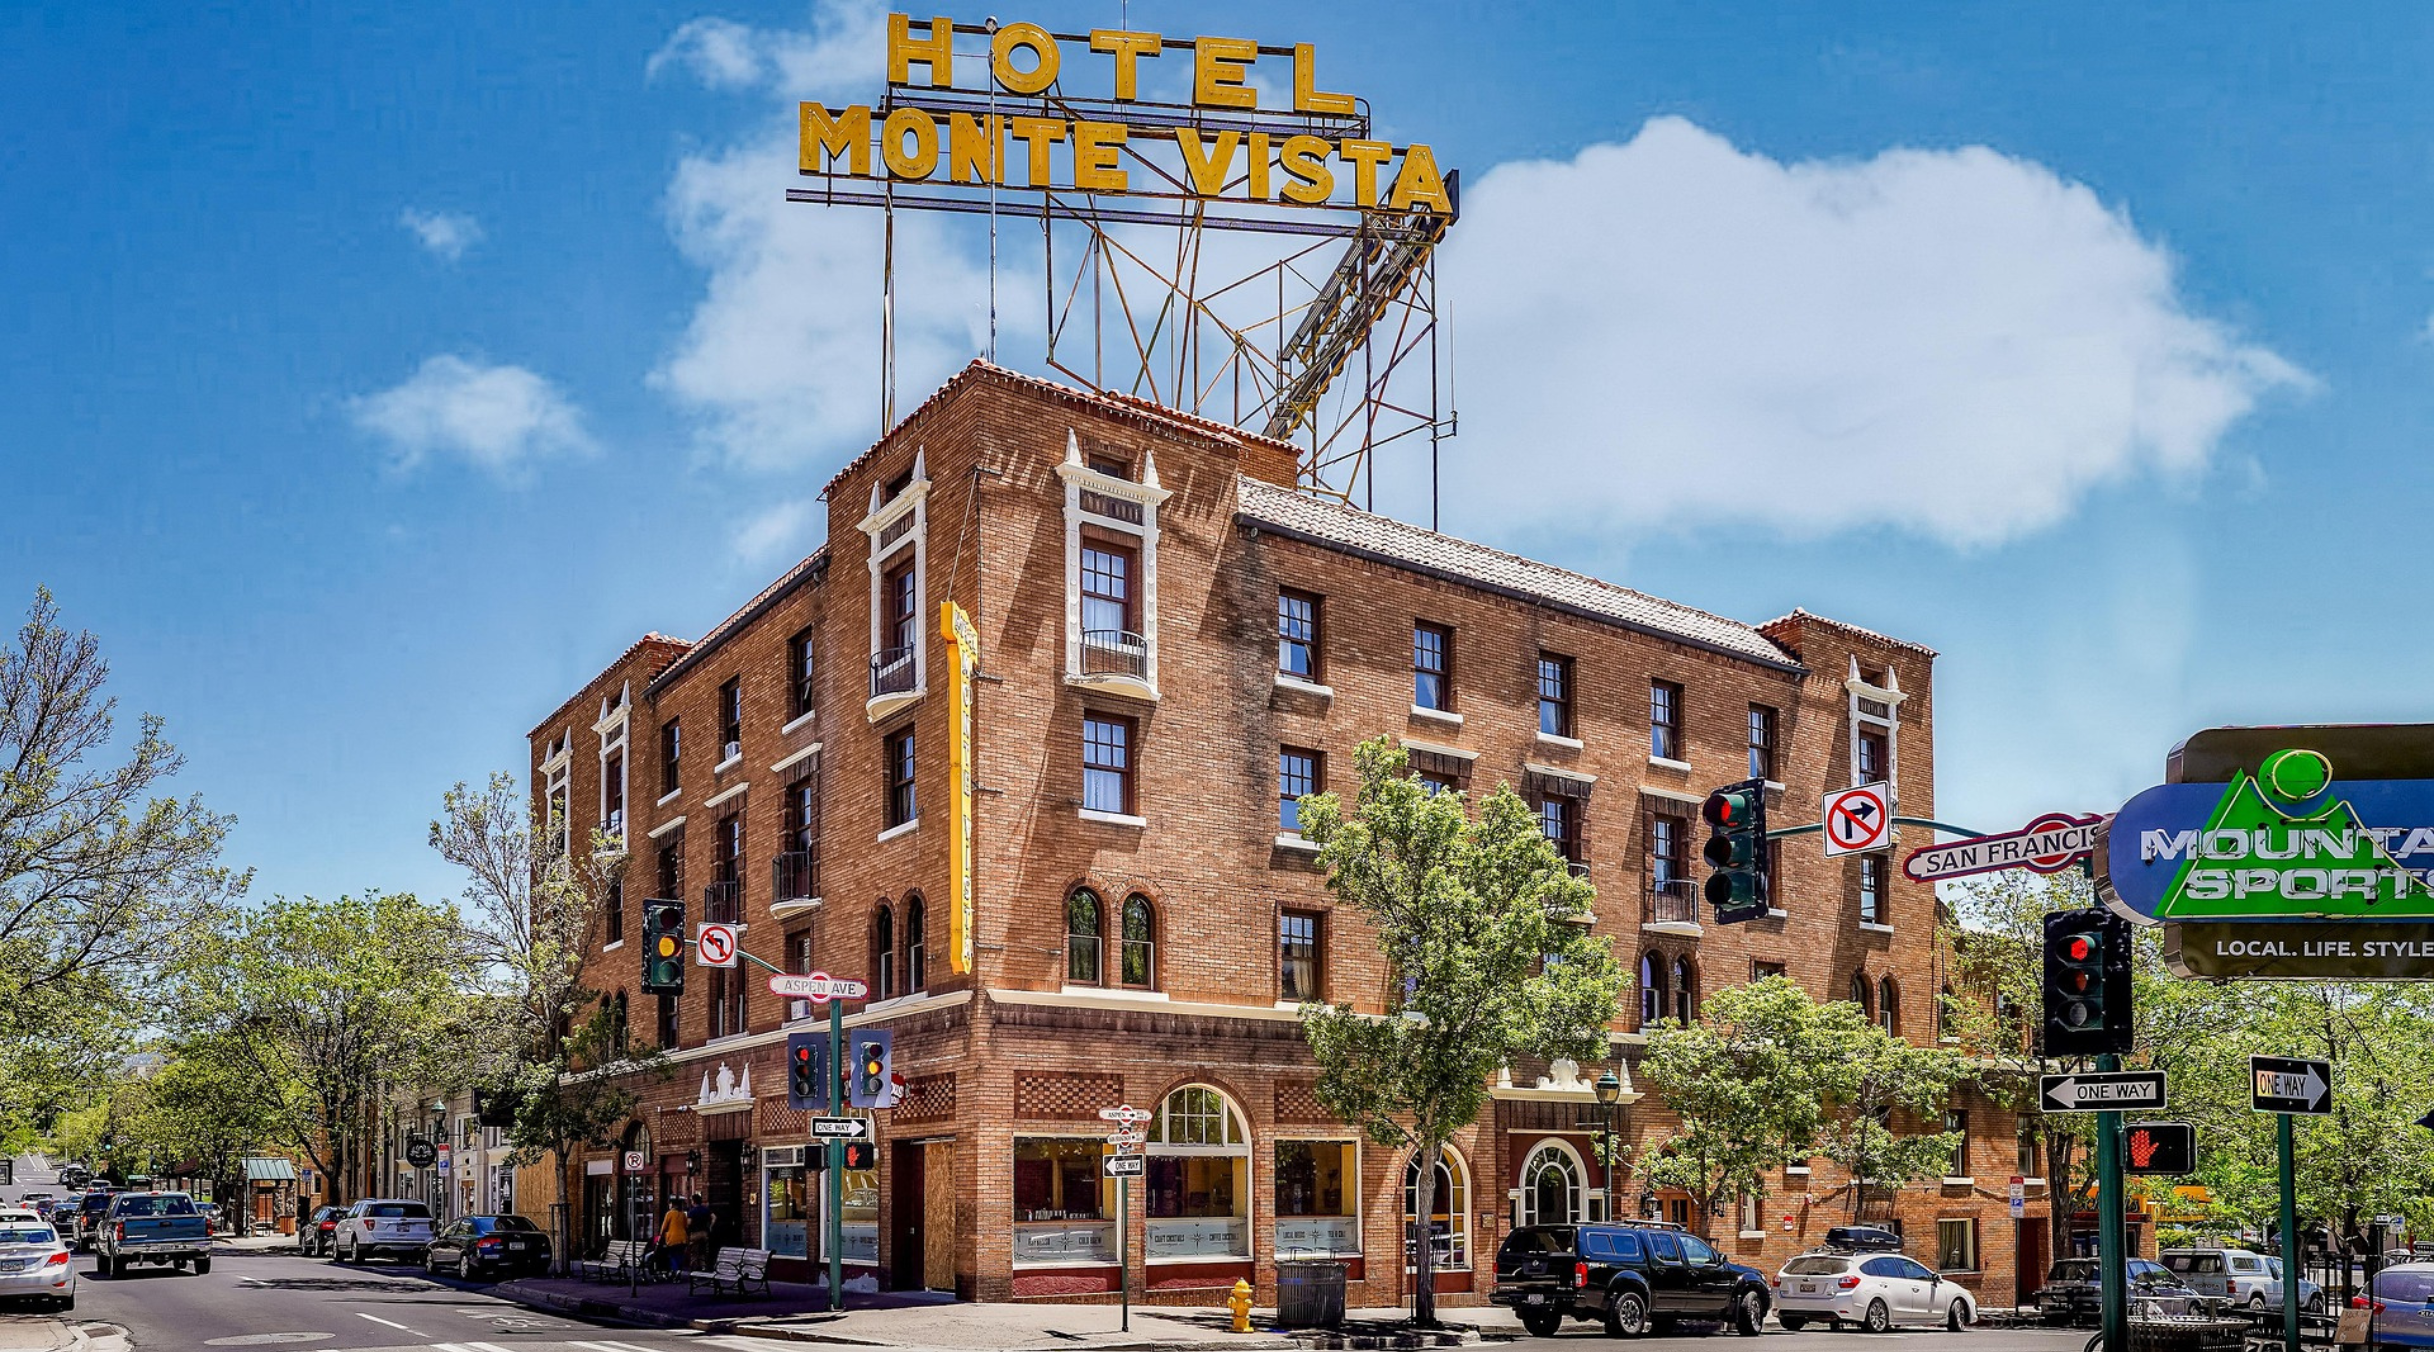
Flagstaff, Arizona
What the Smaller City Risers Reveal
Salem (#82 overall, #13 among small cities) and Flagstaff (#97 overall, #22 among small cities) are the most improbable members of this group – and in some respects the most instructive. Salem ranks #6 on livability among small cities and #8 on lovability, but #159 on prosperity. Flagstaff sits at #8 on livability and #26 on lovability among small cities, but #74 on prosperity. Neither metro would appear on most Americans’ mental map of competitive cities. Yet both improved perception across all three pillars in a field of 393.
The broader small city data explains why this matters. Of the 282 small metros in the dataset, only 43 showed up in our national perception survey as a place people want to visit. Of those 43, an astonishing 42 also showed up as places people want to live – the sole exception being Atlantic City, whose visitor identity is so narrowly tied to gambling that it does not translate into residential aspiration. Every other small city that earned a place in the national visitor conversation simultaneously earned a place in the national residential conversation. The 0.97 lovability-livability correlation holds at small scale just as powerfully as it does for major metros.
For places like Greenville (#64), Richmond (#45), and Cleveland (#41), the rising-city designation points to something similar: these are metros whose investments in their downtown corridors, cultural identities, food scenes, and neighborhood vitality are beginning to register nationally.
The perception gains are early – none of these cities has broken into the Top 25 yet. But perception gains at this stage of the cycle are the leading indicator. The IRS county-level data in the report shows that the regions with the strongest adjusted gross income inflows – the Southeast, the Mountain West, the Austin-DFW-Houston corridor – are the same regions whose cities lead on perception growth. Perception shifts precede migration. Migration precedes investment. Investment strengthens the fundamentals that drive perception further. The cycle is self-reinforcing once it begins.
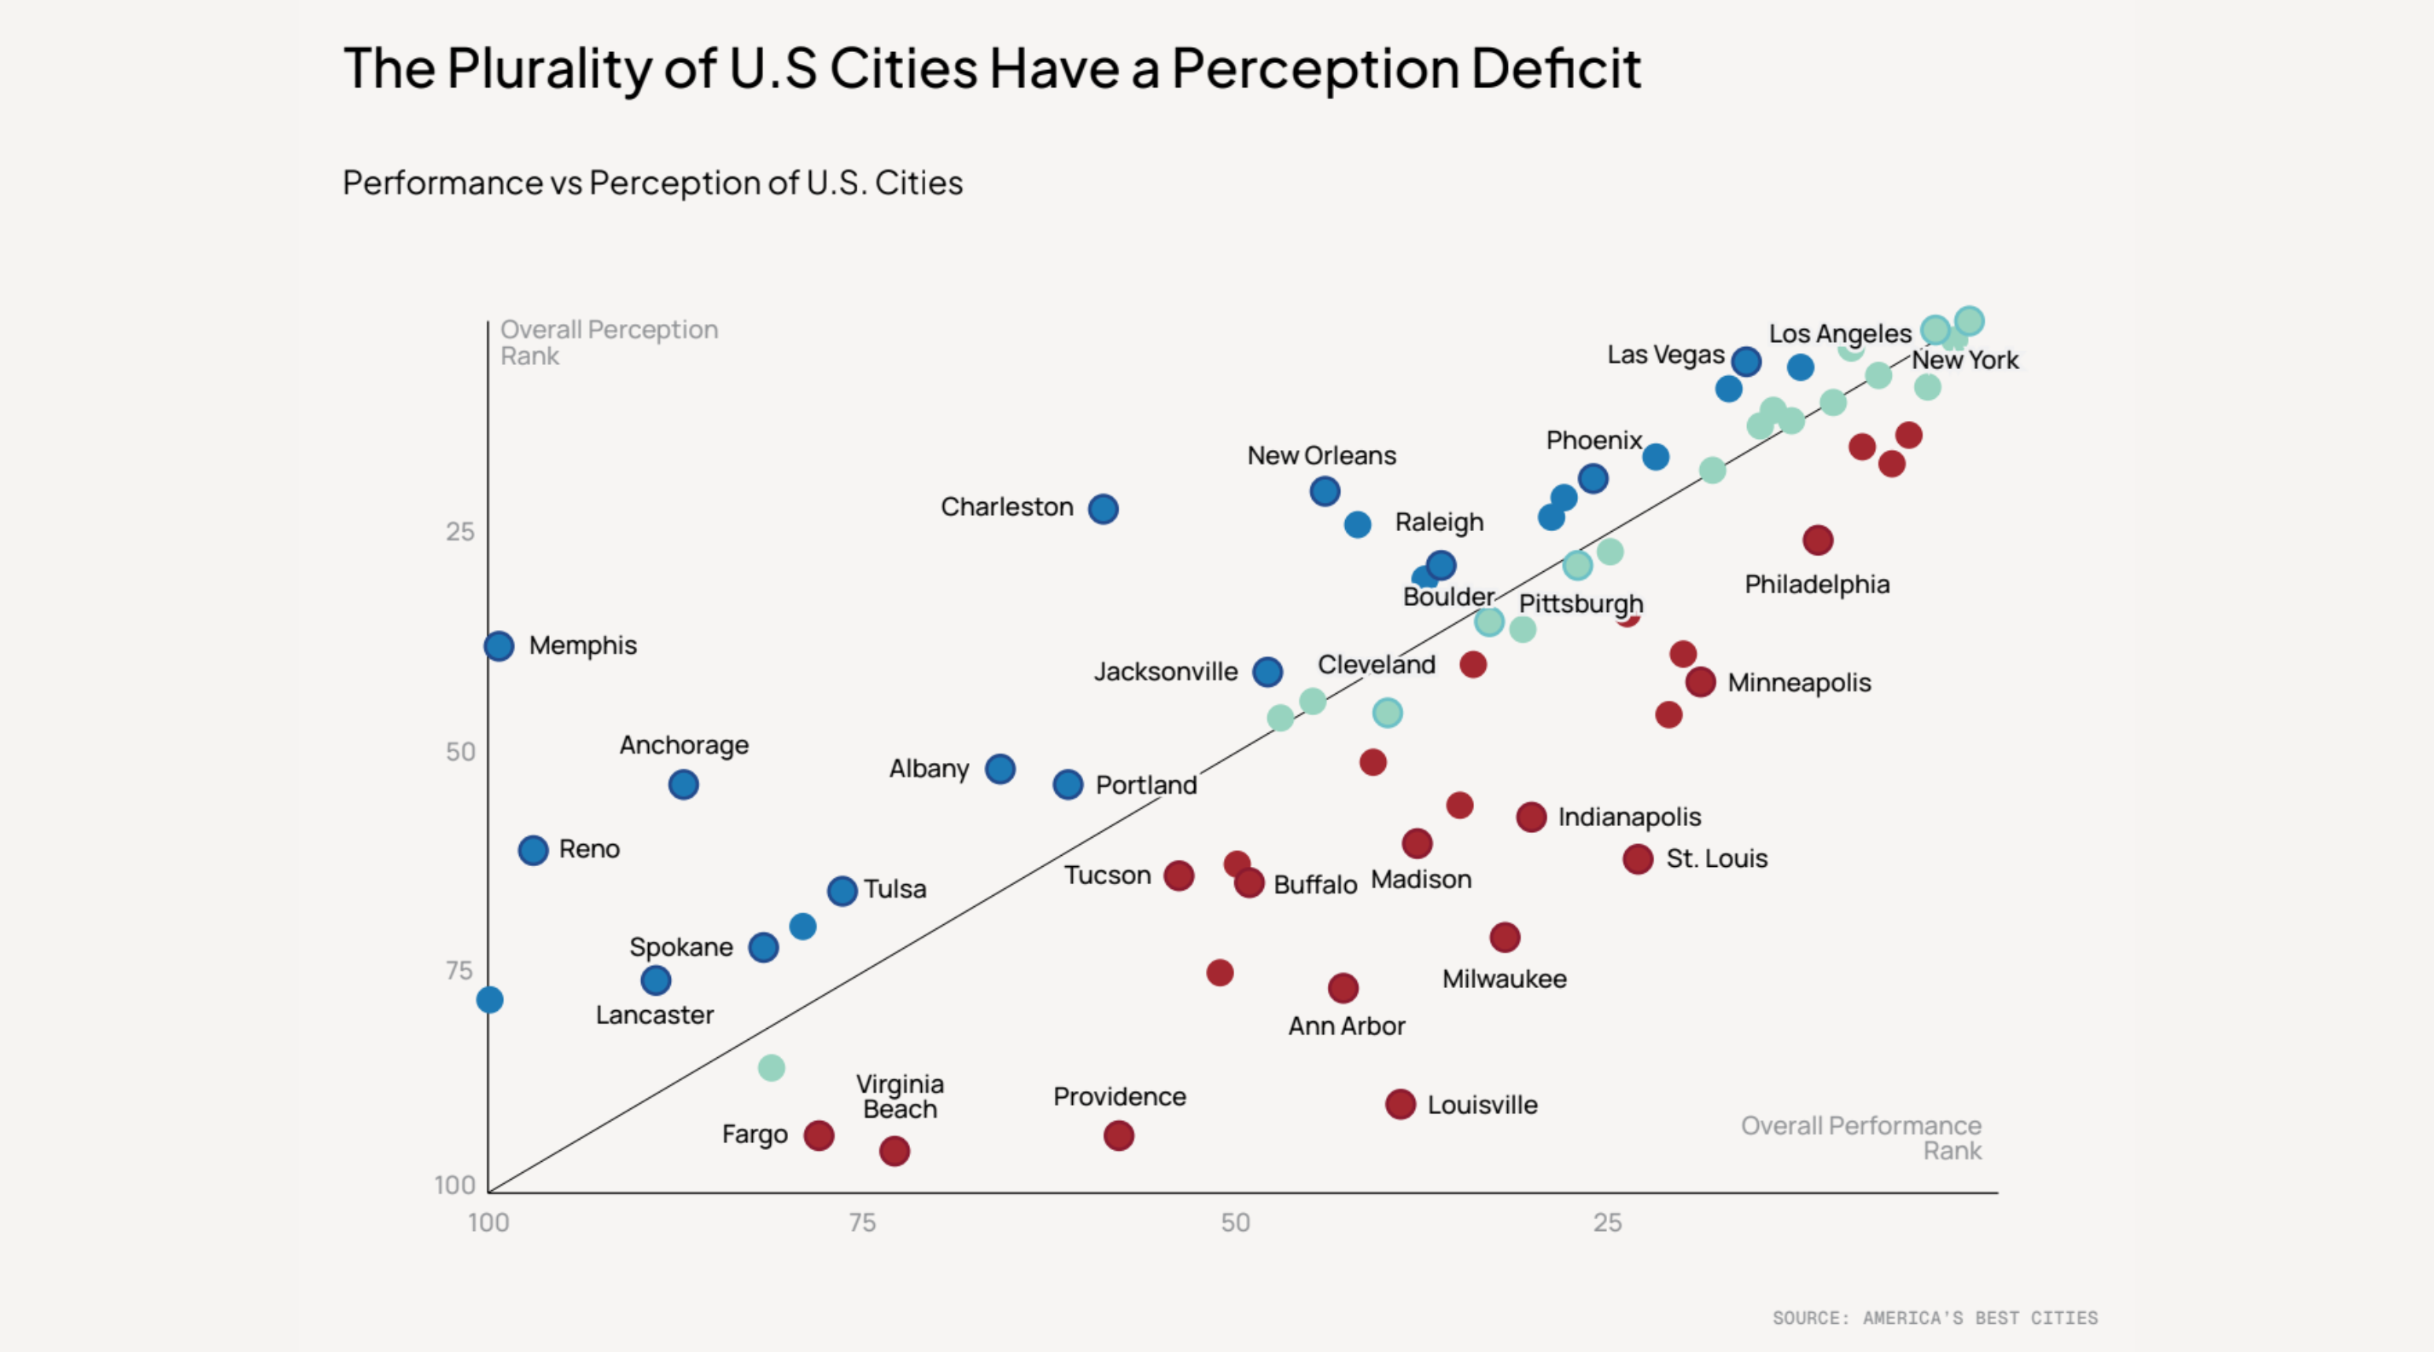
U.S. cities have a perception deficit – and a tremendous opportunity.
What the 11 Rising Cities Teach About Moving Perception
The patterns across this group point to a few principles that hold regardless of a city’s size, region, or starting position.
First, lovability is the most efficient lever for moving overall perception. The data is unambiguous on this point. Livability performance and livability perception have a correlation of just 0.49 – meaning half of what determines how livable a city is perceived to be has nothing to do with how well it actually functions as a place to live. Meanwhile, lovability performance and lovability perception correlate at 0.92.
You cannot fake a great visitor experience, and you cannot hide one. When a city has invested in its restaurants, walkable neighborhoods, cultural programming, and public spaces, the national audience finds out – through travel, social media, and word of mouth. The path to being perceived as a great place to live runs, overwhelmingly, through being perceived as a great place to visit.
Second, pillar balance matters more than pillar dominance. Kansas City’s trajectory is the clearest example, but the principle extends across the group. Cities known for one thing tend to plateau. Cities building recognition across multiple dimensions tend to compound. That does not mean every city should pursue the same mix. Santa Fe’s deliberately lopsided hierarchy works precisely because it is authentic. The point is that perception investment should be intentional about which dimensions it targets and realistic about which gaps are largest.
Third, the sequence is invest, deliver, then tell the story – not the reverse. The cities at the top of the rankings did not build their reputations and then build their visitor experiences. They built the experiences first, sustained them over years, and the reputations followed. Perception follows investment. It does not precede it, and it cannot be manufactured through communications alone.
The competitive field is wider than it has ever been, and the pool of people American cities are competing for is not going to grow the way prior economic cycles assumed. The 11 rising cities are a case study in what happens when a place takes that reality seriously – and invests accordingly.
Download the full 2026 America’s Best Cities report, featuring rankings, data, and strategic analysis for all 393 U.S. metropolitan areas, and reach out if you’d like to learn more about the perception and performance of your particular city – we’d love to chat.
Similar Articles